It’s a question that I am asked frequently as I prowl the pits, paddocks, and garages of endurance and sports car races around the world. Is he just a weird anorak or is there a method to the madness? I’ll leave it to the judgment of the observer as to whether the former may indeed be the case, but I will offer a rationale.
Devotees of Time and Two Seats, the now ancient tome for which I am famous, will understand that eventually this data will find its way into published form. For those less familiar with the work or new to the projects surrounding it, here is a bit of a refresher. The objective is to render results data from significant races onto a standardized data platform and then to create tables from that which will become part of the next book—actually a series of “books” which will have both an electronic and print format.
There is no better way to illustrate than to take that most “over the top” race, the Nürburgring 24 Hours, and create a table with enough data to choke many a hard drive (click on the image below for the full PDF).
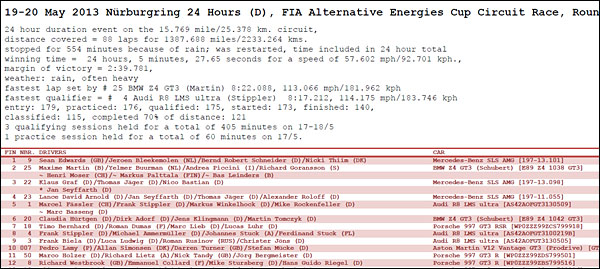
It is immediately clear that this table looks much like the official tables released by the organizers—but not exactly. Moreover, the results may appear to be different, or possibly even at odds to the “official” results. This all takes explanation—lots of it. But in order not to create too many glazed eyeballs, we’ll only discuss some of the key points. You’re welcome to ask me more detailed questions.
This table is one of several thousand that cover international and national endurance, sports, and GT races over the past 15 years, mined since the publication of the original book. Tables for the lower level races have less detail than this one. Different sanctioning bodies, series, and race formulae have a tendency to record data in their own manner. For example, some series will classify every car, others only those that physically finished, while some are based on blend of criteria. Each series also records points according to their own rules, geared towards championship awards. The table shown here is an illustration of standardizing the data such that one can compare results from different series and more readily search (within the source data base) for driver, team, and car records across time.
Another important goal for the table is to best show what really took place at the race. For that reason, the cars are listed in what might be termed “lap chart order.” That is, each car is listed according the number of laps and time completed, regardless of whether it was classified.
Broadly speaking across several decades of endurance racing history the threshold of 70 percent is considered the barometer of whether a car has completed sufficient distance. Again, this varies in practice, but these tables standardize the concept. Thus the table and results summaries treat cars above and below the 70% mark differently. This is a partial explanation for some of the notations such as “NRF” (not running at finish) or “NC” (non-classified finisher).
The columns at the right list a set of standardized points awarded to marques, teams, and drivers. This is another area where considerable explanation can be provided—but not here. More clearly, the actual car by car listing presents drivers in the order that they took the wheel during the race. Drivers who were on the provisional list but did not subsequently participate are noted with certain symbols. Class winners are shown in bold. (As we get close to publication the graphics will be made friendlier all around.) I’ve kept drivers using pseudonyms the way they were shown—I know their real names but as I don’t like letters from lawyers or late night knocks on the door we’ll stick with the fantasy names.
Enjoy browsing through the table. There’s plenty more where that came from.
As for the Nürburgring 24 itself, this was my fourth time attending and collecting this level of detail. I continue to be amazed by this event. It is like no other. It is always fun to explain it to someone who has never been there. It goes something like this—“It is a race where nearly 200 cars of highly different speed potential of up to three minutes per lap, run by teams ranging from top factory entrants to one car amateurs, driven by everyone from Grand Prix veterans to rookie gentlemen, share limited garage space and run on a very long and narrow circuit during rapidly changing weather and lighting conditions and it all takes place almost without major incident.” The response to that summary is always, “that’s impossible.” Indeed, only the ever-efficient Germans could pull this off.
Topping off the event are a quarter million “drunk and orderly” fans. Again, only in Germany. The formation lap is a sight to behold as they stream across the track, hoist their steins on high and salute the starters. On command, they obediently scale back across the fences and enjoy the action.
In recent years the race has certainly become exceedingly professional at the top, with factory-backed teams from Mercedes, Audi, and BMW featuring significantly this year. But another unique element here is the many dozens of highly skilled drivers who toil in the next level down. Every sport has its “bum”—there is the “ski bum” and the “surf bum.” The Nordschleife is the certified Mecca of the “Race Bum.” While few of them are known past the city limits of Adenau, they represent some of the finest specialists in the sport. They do have one delightful ambassador who is better known—Sabine Schmitz.
Altogether, no other race has this kaleidoscope of skill and silliness, innovation and old technology (fancy a 30-year old Opel Manta?). It is a race that needs to be seen to be believed.
Janos Wimpffen