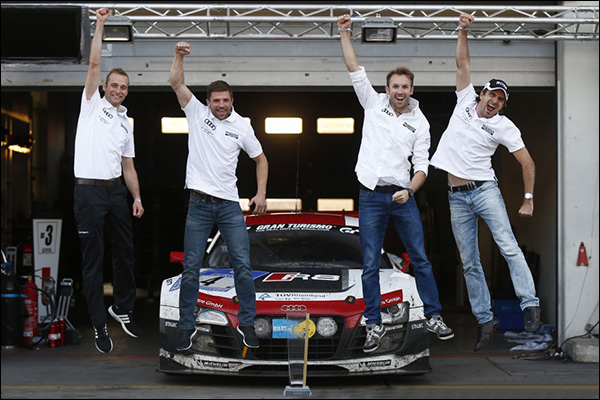
With back-to-back wins in the 24 hour races at Le Mans and the Nürburgring, Audi can be feeling rather pleased with itself at the moment. Of course the success has not been due purely to the workers at Audi AG headquarters in Ingolstadt, but also to the efforts of various racing partners engaged by their Audi Sport subsidiary: in particular, but not exclusively, Joest Racing and Phoenix Racing.

But of course the publicity value to the “brand with the four rings” of wins in two major endurance races will have been substantial, and those in the board-level positions where budgeting decisions are made, will no doubt be encouraged by the fact that their investments in motor sport have borne such fruit.
Audi may draw attention to the suggestion that neither at Le Mans or the Nürburgring were their cars the quickest. But at both events they won due to a combination of factors: including better reliability, efficiency and maintainability, but outright speed? Well, that’s what I would like to address here.
Let’s look at the two races in a bit more detail. First, Le Mans. In the first 12 hours of the race, the no. 7 Toyota built up a lead of 1m 55.949s, by which time both it and the second-placed Audi no. 2 had pitted 14 times. Interestingly, the time spent in the pits by the no. 7 was already 22m 03s – the Audi’s time in the pits was 18m 49s, so if Toyota could have matched Audi’s pit efficiency, it would have been more than a lap ahead.
However, as all but the diehard fans were back in their hotels and tents in various states of alcoholic stupor, that no. 2 Audi was making up ground on the Toyota. At the end of lap 217, 30 laps and nearly 2 hours (3 pit stops) later, the gap was 1m 33.871s. Extrapolation is a dangerous thing (as my maths teacher used to say), but at the rate of ten seconds per hour, it is perhaps fair to suggest that there was enough of the race remaining (ten hours) for the Audi to have been able to lead on merit.
The danger in extrapolation is the assumption that all else remains the same. There is evidence in this case though that the average lap times of the Audi between 5am and 12 noon were improving considerably more than those of the Toyota would have done. Look at the figures:
Average of best 25 laps in period from 15:00 – 00:00 (137 laps)
1 – Audi R18 e-tron quattro – 3m 26.372s
2 – Audi R18 e-tron quattro – 3m 25.878s
7 – Toyota TS040 Hybrid – 3m 24.924s
8 – Toyota TS040 Hybrid – 3m 25.240s (time period extended to allow for time spent in pit)
Average of best 25 laps in period from 05:00 – 12:00
1 – Audi R18 e-tron quattro – 3m 26.487s
2 – Audi R18 e-tron quattro – 3m 24.858s
7 – Toyota TS040 Hybrid – N/A
8 – Toyota TS040 Hybrid – 3m 26.082s
The evidence is clear that the no. 8 Toyota was not as quick in the second part of the race as it was in the first. The data above suggests it was losing ten seconds per stint on its pace early in the race. Even if the no. 7 Toyota had been able to maintain its speed in the later stages, it looks like the no. 2 Audi would have continued to lap more quickly. Add to that the shorter Audi pit stops, and you would have to conclude that the only thing that would have prevented an Audi victory was a mechanical failure.
Which, however unthinkable, was of course exactly what happened. But with more serious problems afflicting the competition, it didn’t prevent the trophy going to Ingolstadt yet again. However, it is an over-simplification to say that Audi won Le Mans in 2014 with the slower car. If Toyota is going to win Le Mans in 2015, they need not only to improve reliability, but they also need to go faster!
At the Nürburgring a week later, however, there is considerably more striking evidence of Audi being slower than the opposition. Look at the following table of best laps set during the race:
|
Car No.
|
Car
|
Best Race Lap
|
|
66
|
Dörr Motorsport McLaren
|
8m 19.607s
|
|
7
|
Aston Martin Vantage
|
8m 20.682s
|
|
17
|
G-Drive Audi R8 LMS ultra
|
8m 20.813s
|
|
14
|
Black Falcon Mercedes SLS AMG
|
8m 20.975s
|
|
4
|
Phoenix Audi R8 LMS ultra
|
8m 21.045s
|
|
1
|
Black Falcon Mercedes SLS AMG
|
8m 21.351s
|
With reliability in mind, it is worth also considering that only three out of the fastest six were still running after 24 hours, so the mantra of ‘to finish first, first you have to finish’ is obviously key. The Phoenix car also kept itself out of the pits, although the following table is also interesting, showing the number of stops made by the top six finishers:
| Pos. | Car No. | Car | No. of pit stops |
| 1 | 4 | Phoenix Audi R8 LMS ultra | 19 |
| 2 | 1 | Black Falcon Mercedes SLS AMG | 19 |
| 3 | 22 | Rowe Racing Mercedes SLS AMG | 20 |
| 4 | 44 | Falken Tyres Porsche 911 GT3-R | 18 |
| 5 | 7 | Aston Martin Vantage | 20 |
| 6 | 20 | Schubert BMW Z4 GT3 | 20 |
So if the Aston Martin and the Rowe Racing Mercedes spent too long in the pits to win, and the Falken Tyres-sponsored Porsche was too slow to win, then how did the Audi still manage to beat the Black Falcon Mercedes? The answer lies, as regular readers will have guessed by now, in average lap times.
Taking the average of the best 25 laps during the race gives:
| Car No. | Car | Average Lap Time |
| 4 | Phoenix Audi R8 LMS ultra | 8m 23.298s |
| 20 | Schubert BMW Z4 GT3 | 8m 23.772s |
| 7 | Aston Martin Vantage | 8m 24.911s |
| 1 | Black Falcon Mercedes SLS AMG | 8m 25.868s |
| 22 | Rowe Racing Mercedes SLS AMG | 8m 26.127s |
| 44 | Falken Tyres Porsche 911 GT3-R | 8m 29.759s |
| 66 | Dörr Motorsport McLaren MP4-12C | 8m 30.495s |
The thing that perhaps most characterises both wins was the relative performance of the car over the 24 hour period. My final table (for now) shows the average lap times in each quarter of the race at both Le Mans and the Nürburgring.
Le Mans Average Lap Times:
| Car No. | Car | 1st Quarter Average | 2nd Quarter Average | 3rd Quarter Average | 4th Quarter Average |
| 1 | Audi | 3m 26.938s | 3m 27.225s | 3m 27.311s | 3m 26.465s |
| 2 | Audi | 3m 26.109s | 3m 26.979s | 3m 26.627s | 3m 25.137s |
| 7 | Toyota | 3m 25.095s | 3m 26.485s | 3m 29.811s | |
| 8 | Toyota | 3m 25.330s | 3m 27.407s | 3m 27.540s | 3m 26.039s |
| 12 | Rebellion | 3m 31.608s | 3m 33.943s | 3m 32.545s | 3m 30.333s |
| 14 | Porsche | 3m 27.610s | 3m 27.719s | 3m 28.153s | 3m 27.085s |
| 20 | Porsche | 3m 27.754s | 3m 29.750s | 3m 30.157s | 3m 29.509s |
An interesting exercise for the reader is to add the first and second quarters together and then compare that with the sum of the third and fourth quarters. This shows very clearly how the Audis get quicker in the second half of the race.
Nürburgring Average Lap Times:
| Car No. | Car | 1st Quarter Average | 2nd Quarter Average | 3rd Quarter Average | 4th Quarter Average |
| 4 | Audi | 8m 27.408s | 8m 35.473s | 8m 22.830s | 8m 23.492s |
| 1 | Mercedes | 8m 30.678s | 8m 37.339s | 8m 24.011s | 8m 28.017s |
| 22 | Mercedes | 8m 31.627s | 8m 37.695s | 8m 25.797s | 8m 25.392s |
| 44 | Porsche | 8m 35.557s | 8m 41.688s | 8m 28.199s | 8m 30.904s |
| 7 | Aston | 8m 30.353s | 8m 42.117s | 8m 25.455s | 8m 23.650s |
For Le Mans, I have taken the average of the best 25 laps in each quarter, and at the Nürburgring, I have taken the average of the best 10 laps. In each case this represents around an hour and a half’s worth of driving in six. Clearly, the driver at the wheel has a big influence here, as does the state of the track (yellow zones, safety cars, etc). But in both cases, such conditions are the same for all, so it provides a useful comparison. It seems that it is during the period immediately after half distance when the race can be won.
Paul Truswell